Hello all! I’m Sally and I blog over at Life Loving. My blog is my way to inspire others to get out and about and enjoy life more. I live by the motto ‘ketchup tomorrow, relish today’. I’ve worked in marketing for many, many years and thought it might be useful to offer a few tips on how to use Google Analytics.
It’s not often you get something free in life, but with Google Analytics you do! It’s a completely free reporting package that you can connect to your blog which you can use the data to your advantage. You’ve probably got it already connected up, but you may not have looked into what the data is telling you. So here’s my intro to Google Analytics. I hope this is useful when you want to find some information out about your blog and its visitors.
Audience
The first place to start in Google Analytics is to have a look at the audience reports. The overview report is a great place to see how many users have visited your website and how many pages these users looked at whilst they are there.
Bounce rate is a metric which is often used when talking about websites. This measures how many people only visit one page before leaving the website. Generally speaking, a high bounce rate is not a good thing, but blogs will notoriously have a high bounce rate, due to the nature of the visitors reading a single post and then leaving. A high bounce rate is really only something to be concerned about if you have an e-commerce website as you want your visitors to visit multiple pages, including your checkout page.
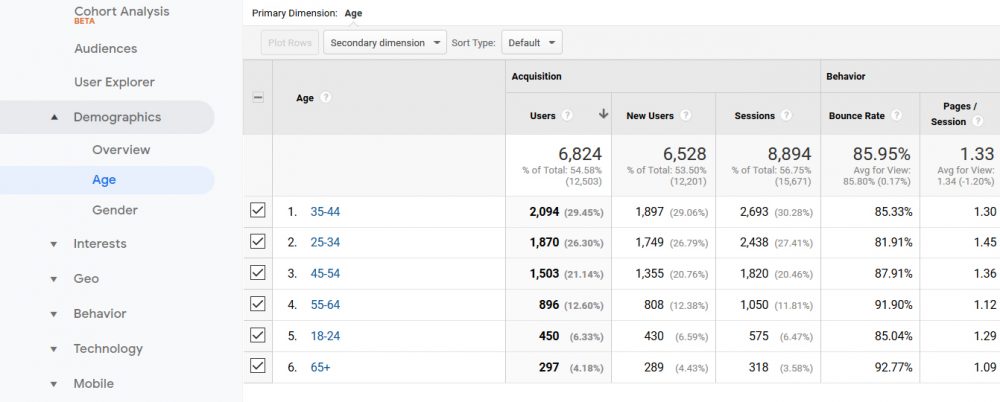
Within the audience reports, you can drill down into the demographics of your visitors. Metrics like age and gender are available here. You can also look at the interest categories of your visitors and their location in the world. These are useful stats if you are pulling together a media pack or a pitch document for a brand. If you know you have a high proportion of females visiting your site, this could be a key USP for a female-oriented brand.
Acquisition
This is one of my favourite areas of Google Analytics. I usually head straight into the Source/Medium report which is held under the ‘All Traffic’ category. This tells me where my website traffic is coming from. If you are really active on social media, you should see lots of referring traffic from Pinterest, Twitter or Facebook in here. You might also find that you can see traffic coming from the main search engines, Google and Bing. If you send out an email newsletter, you can easily pull out how much traffic each one has driven on to your blog. This will tell you what’s working and what’s not from a promotional point of view.
Behaviour
There are some great reports in the behaviour section of Google Analytics and it’s well worth spending some time here. I like the ‘Site Content’ reports best. There are two main sections to look at. One is ‘All Pages’. This will tell you the most popular pages on your blog. So which of your posts have been most popular. The other report is the ‘Landing Pages’ report. This tells you which of your pages is the most popular for visitors first coming to your website. This is important as you can tell which posts are good link bait for social media and also which posts rank well in the Google and Bing search algorithms.
Things To Remember
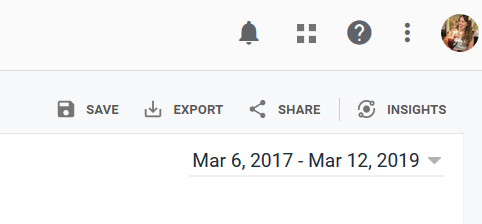
A couple of other things to remember when using Google Analytics is to set the date range of what you want to see. If you’ve had a traffic spike, you might want to drill down to just one day to see what’s driven that spike. If you are putting together a media pack, you might want to select a whole year’s worth of data. Just adjust this from the date options on the right-hand side.
If you are looking at data for a purpose, you can easily export the tables and graphs so you can include this in your documents. Just look for the export button at the top right.
Google Analytics is a great tool and the above is just a very brief intro to some of the reports you can use to see how well your content is working and what promotion channels work for you. Once you feel confident navigating your way around these areas, there are heaps more to explore. You can set up custom reports which can be emailed to you on a regular schedule. You can even see your visitors’ journeys, as they come to and from your website. You could literally lose days looking through all the information available.

I hope you’ve found this intro useful. Feel free to add any questions or comments below. I’m also available on the socials if you have any questions about Google Analytics. You can find me here –
Twitter
Instagram
Facebook
Fancy checking out another post? Just click here!
Pin It!